When Alice plotted the resulting picture, they were all surprised to
see an almost one-dimensional plot, barely visible on the screen.
There seemed to be two particles moving away from the center, one
reaching ![]() on top, and one reaching
on top, and one reaching ![]() below. The
tick marks and labels on the
below. The
tick marks and labels on the ![]() axis were so compressed, they were not
even readable.
axis were so compressed, they were not
even readable.
Alice then pointed out that it was likely that there had been a close near-simultaneous three-body encounter, from which two stars emerged as a tight double star, a binary in astrophysical terms. Since a tight binary has a large negative binding energy, the remaining positive energy has to be carried away by the third star. Since we are plotting orbits in the c.o.m. frame, the direction of the single star's escape orbit must be exactly opposite from the direction of the escape orbit of the double star. And since the latter carries twice as much mass as the single star, its speed in the c.o.m. frame has to be half as large as that of the star escaping by itself. This explains why the track moving downwards has reached twice as large a distance from the origin as the track moving upwards. Although not visible in the terribly skinny figure, the upwards track must be that of the binary, and the downwards track that of the single star.
Given the large distance that the stars had traveled, Alice decided to be more conservative, and try to run the simulation for only 200 time units, rather than 1,000. Here is her result:
|gravity> leapfrog2a > leapfrog2a_0.00001_200.out
Please provide a value for the time step
0.00001
and for the duration of the run
200
Initial total energy E_in = -0.866025
Final total energy E_out = -0.866025
absolute energy error: E_out - E_in = 9.36223e-11
relative energy error: (E_out - E_in) / E_in = -1.08106e-10
|gravity>
The accompanying plot she made was still very skinny. They at least
could see a few tick marks below along the ![]() axis, though all the
numbers there were still printed on top of each other. The upwards
track reached
axis, though all the
numbers there were still printed on top of each other. The upwards
track reached ![]() , while the downwards track extended to
, while the downwards track extended to ![]() .
And indeed, the upwards track could now be seen to be slightly thicker
than the downwards track, in agreement with Alice's prediction that
that one was formed by the two stars in a tight binary.
.
And indeed, the upwards track could now be seen to be slightly thicker
than the downwards track, in agreement with Alice's prediction that
that one was formed by the two stars in a tight binary.
Again shortening the duration of the run, Alice let the stars run to t_end = 150:
|gravity> leapfrog2a > leapfrog2a_0.00001_150.out
Please provide a value for the time step
0.00001
and for the duration of the run
150
Initial total energy E_in = -0.866025
Final total energy E_out = -0.866025
absolute energy error: E_out - E_in = 1.02107e-09
relative energy error: (E_out - E_in) / E_in = -1.17903e-09
|gravity>
And still the plot looked skinny! Most of the interaction region in
the center resembled a single ink blob, and the two tracks now reached
to ![]() and
and ![]() , respectively. They concluded that the close
encounter leading to the double escape must have taken place soon
after t = 100. The reasoning was as follows: if the stars
move in a straight line in uniform motion, an extrapolation of the last
two results would lead to two short tracks already having started at
t = 100, reaching
, respectively. They concluded that the close
encounter leading to the double escape must have taken place soon
after t = 100. The reasoning was as follows: if the stars
move in a straight line in uniform motion, an extrapolation of the last
two results would lead to two short tracks already having started at
t = 100, reaching ![]() and
and ![]() , respectively. However, the
particles are decelerating, due to the gravitational interaction
between the single star and the double star. Therefore, the initial
separation must have happened at a higher speed, moving the time of
the close three-body encounter further toward the future, most likely
around or slightly after t = 100.
, respectively. However, the
particles are decelerating, due to the gravitational interaction
between the single star and the double star. Therefore, the initial
separation must have happened at a higher speed, moving the time of
the close three-body encounter further toward the future, most likely
around or slightly after t = 100.
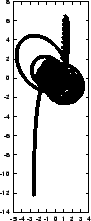
To check this reasoning, Alice produced an even shorter run, this time only to t = 120:
|gravity> leapfrog2a > leapfrog2a_0.00001_120.out
Please provide a value for the time step
0.00001
and for the duration of the run
120
Initial total energy E_in = -0.866025
Final total energy E_out = -0.866025
absolute energy error: E_out - E_in = 1.48818e-11
relative energy error: (E_out - E_in) / E_in = -1.7184e-11
|gravity>
This finally produced a reasonable plot, with readable numbers along
the ![]() axis:
axis:
 |
Looking back at the three overly skinny plots, not shown here, and using the numbers they read off as reported above, our friends noticed that the separation between binary and single star at time t = 1000 was about seven times larger than at time t = 200. Uniform motion would have predicted an increase of separations by a factor nine. The actual factor seven was recognized as evidence that the relative motion between single star and binary was still slowing down. The question was raised whether the stars would fall back again eventually, or whether they would really escape in opposite directions. To answer this question, their was no need for an extra plot. They just ran a run of a billion time steps (which took a while) and tossed out all but the last few lines of the output:
|gravity> leapfrog2a | tail
Please provide a value for the time step
0.00001
and for the duration of the run
10000
Initial total energy E_in = -0.866025
Final total energy E_out = -0.866025
absolute energy error: E_out - E_in = 6.29064e-09
relative energy error: (E_out - E_in) / E_in = -7.26381e-09
-68.4785 1632.06 0 -0.137523 -0.382285 0
137.396 -3263.57 0 0.0141025 -0.325753 0
-67.9165 1631.51 0 0.112159 0.719282 0
-68.4798 1632.06 0 -0.126162 -0.39353 0
137.396 -3263.57 0 0.0141025 -0.325753 0
-67.9154 1631.51 0 0.100483 0.73056 0
-68.481 1632.05 0 -0.114485 -0.404807 0
137.397 -3263.57 0 0.0141025 -0.325753 0
-67.9145 1631.52 0 0.0884761 0.741873 0
-68.4821 1632.05 0 -0.102479 -0.41612 0
|gravity>
This proved clear evidence for final escape of both binary and single
star. Whereas the single star had separated from the binary by a
distance of 320+160=480 units along the ![]() axis at t = 1000,
the separation had now increased to about 4900 units, in a roughly
eleven times longer interval, counted from the slingshot event around
t = 100. The conclusion was that there had been some residual
slowing down, given that the separation had increased by a factor ten
rather than eleven, but that escape had been established, since there
was no indication that the slow-down would be enough to lead to a fall
back.
axis at t = 1000,
the separation had now increased to about 4900 units, in a roughly
eleven times longer interval, counted from the slingshot event around
t = 100. The conclusion was that there had been some residual
slowing down, given that the separation had increased by a factor ten
rather than eleven, but that escape had been established, since there
was no indication that the slow-down would be enough to lead to a fall
back.
After concluding once that it was high time to write better analysis tools, which would allow a more direct investigation of the questions they had now answered in a somewhat haphazard way, our friends called it quits for that night.